
Parking Data helps Generate Revenue and Improve Experience
The move to digitally capture parking data can be an essential tool to evaluate your parking operations and find ways to make improvements that help generate revenue and improve the driver experience. While not everyone looks to parking as a revenue source, they should be evaluating their data to see if they are reaching their goals and maximizing their parking real estate.
A company like Smarking provides a tool to help parking management companies analyze their data and forecast revenue which allow organizations to make smart decisions based on what the numbers are telling them.
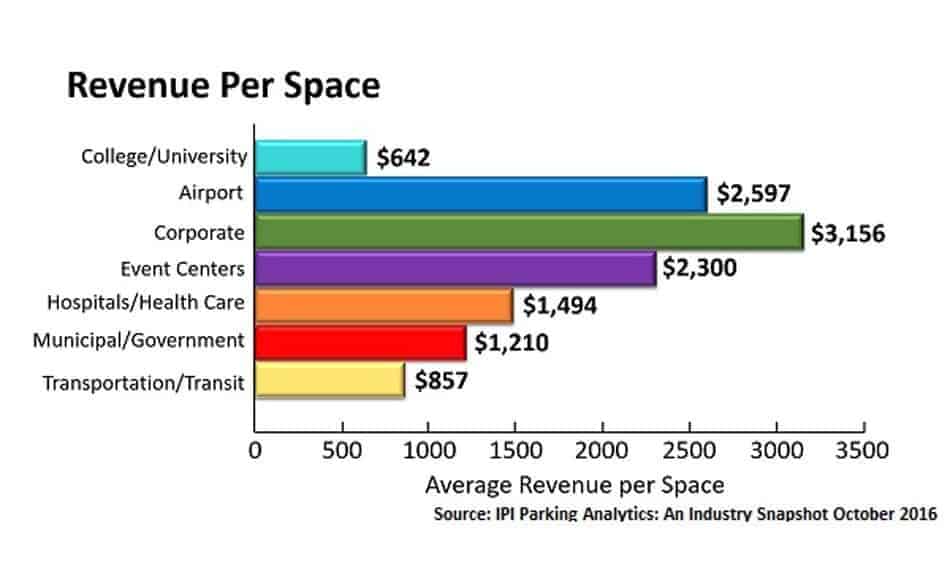
The International Parking Institute’s report Parking Analytics: An Industry Snapshot shows corporate parking generates more than $3,000 on average per parking space (See Chart Above).
Colleges and Universities come in on the lower side with only $642 per space, with municipalities, airports, hospitals and other industries in between. Of those that completed the survey, 69% said they expected their revenue to increase the following year.
As a result, using the parking data collected with different technologies to help forecast what that increased revenue will be, and how they will achieve it is good practice for parking maintenance budgets.
Capturing parking data
The more data you capture over time, the better you’re able to use it to help make strategic decisions about how you administer and structure your parking. As a result, the digital tools today let you track a variety of metrics. For example:
Violation analytics will help you understand where and when violations are most likely to occur
What can you do with it?
We call these violation hot spots, and they can be mapped for your enforcement team to easily identify the location and the number of violations over the most recent four weeks. You can use the parking data to manage better and schedule patrols, evaluate changes to time limits in high violation areas or understand how you can redirect parking traffic to other locations.
Some refer to these hot spots as violation “fishing holes”. These are the areas where we can be certain that a patrol will find vehicles that are abusing parking rules. These “fishing holes” can be a great source of revenue, and with analytics the day of week or time of day detail can be easily assessed.
Occupancy rates and duration are statistical possibilities with LPR or sensor technology
What can you do with it?
Adjust rates based on demand for peak times and key locations; customize time limits for individual times, days, or locations; direct traffic to available locations; and identify ways to bring traffic to underutilized spaces.
An excellent source of revenue is the overselling of parking. With this analytical data it is possible to determine what percentage of overselling an area will support.
Historical revenue data is important to forecasting
What can you do with it?
Understand the implication of rate changes and adjustments, forecast the effect of targeting pricing for things like special events or demand-based pricing, and better understand sources of revenue variances.
The old adage of supply-and-demand comes into play here. With an understanding of when demand is high, supply can be controlled using price points that are bit higher or lower to ensure available parking for all, and an opportunity to increase revenue.
Examples of how to use the data
Municipalities can use their data in different ways to find changes that can reduce congestion. This can help drivers find the spots they want, at rates they want to pay.
City of Edmonton – Epark
The City of Edmonton’s EPark system collects occupancy data and lets the City analyze how drivers are using parking in different areas. They launched their EPark system in 2015 knowing that the data they collected could help them consider a predictive parking model with variable rates based on peak hours and congestion. Then, in late 2016 they announced they were reviewing rates for the downtown parking zones based on the data they collect. Finally, they hope to use occupancy rate data throughout the City to determine whether rate changes can balance the use of underutilized spaces. Earlier in the year, they made changes to accommodate parking congestion at Rogers Place in the City. Event night parking is no longer free after 6 pm with extended time restrictions to assist patrons.
Pittsburgh Cultural District – ParkPGH
ParkPGH was a first of its kind when introduced in 2010. It’s a smart parking solution developed by the Pittsburgh Cultural District (PCD). It helps manage congestion especially when demand is at its highest during events. The system uses both historical and real-time data from public and private parking facilities to inform drivers of spot availability. In 2015, the City of Pittsburgh announced it would be using data from ParkPGH to provide drivers with spot availability notices through parking garage wayfinding. In 2012, ParkPGH estimated an over $313,000 impact on reduced gas expenditures, congestion reduction, and time. At that time they projected an over $1.2M annual impact once fully deployed.
San Francisco – SFpark
SFpark is an example of demand pricing for parking. SFpark started as a pilot program in 2011 with 7,000 or the City’s 28,800 metered parking spaces. It included 15 of the 20 City-owned garages. They installed sensors and smart meters for their on-street parking and collected data on occupancy rates and duration. Based on the trends they observed, they adjusted rates by block, time of day, and day of the week. As a result, prices increase incrementally until at least one space on the block is available. This means rates at a meter can vary from $0.50 per hour up to $6.50 per hour depending on demand. It also means that traditionally underutilized spaces get used more often. In addition, you will see a reduction in traffic congestion in high demand zones. Notification to drivers of pricing comes via mobile apps. SFpark has an open data and source code approach to encourage independent developers to create new tools for drivers.
Tips on how to use your data
Just getting started with collecting data in a meaningful way? Here are a few suggestions as you start to travel down this road.
- Collect and keep as much parking data as you can. It may not be relevant to what you are doing today, but it may be relevant for you down the road. Maximize the abilities of the systems you’re using and gather and save what you have access to.
- Be sure you understand what problems you’re trying to solve or goals you’re trying to achieve before you start. Look for the data that helps you answer those.
- Dig in and see where it takes you. It’s only by looking at the data from different angles that you’ll find a new perspective. Consequently, you don’t need to be an analytics expert to be effective at evaluating the data.
- As a result, you wear a few different hats when you do your analysis. Look at the data and reports from an administrator, parking patron, and parking management perspective.